One of the pillars of the execution of performance-enhancing strategies is the monitoring and management of training load, both in the short term and over longer periods of time. No matter what approach or model is used, they are all designed with the same goal in mind: manipulating FATIGUE.
Every coach in the world is aware of how crucial it is to keep an eye on and manage fatigue, not only to increase performance generally but also to lower the risk of injury, prevent inhibition of correct adaptation, and achieve peak performance at specific times, such crucial matches or competitions.
Actually, managing fatigue is a fundamental component of every training programme. Although the idea of managing training loads has become widely accepted, this is quite biased because fatigue, not load, is the limiting factor and thejustification for each and every periodization scheme: Blocks, liens, undulations—you name it.
Through various subjective (like RPE) or objective (like power output) measures, there are several techniques that can be used to examine fatigue from training and athletic competition.
But what exactly is fatigue? Let's attempt to determine that.
Fatigue
Since the beginning, sports trainers and coaches have struggled with fatigue. We can go back to ancient Greece to see how athletics and the military have influenced one another. European research that began in the late 19th century can be linked to more recent efforts to comprehend the variables that affect fatigue and athletic performance. One of the first books to take into account the biological causes of exhaustion that occurs during exercise was authored by the Italian physiologist A. Mosso, a professor of physiology at the University of Turin.
The exercise sciences were slow to adopt Mosso's theories, and they were forgotten until they were recently rediscovered 1. Instead, after 1923, a new and more straightforward interpretation that was supported by English Nobel Prize winner Archibald Vivian Hill took their place. Hill and his colleagues at University College London conducted the investigations that would conceivably end up having the most impact on the history of exercise science between 1923 and 19252.
Generally speaking, fatigue is characterised as a loss of force or power in response to contractile activity and can be brought on by deficits or adjustments at numerous physiological sites34. Additionally, a performance reduction or impairment brought on by exercise can be seen as fatigue 5. But every definition falls short as a reductionistic solution to a more complex problem, and there is still disagreement over the underlying causes and mechanisms of fatigue during exercise.
Central and/or peripheral components are responsible for limiting this decrease in muscular capacity. The peripheral components entail a biochemical change in the metabolic milieu of the muscles, which results in an attenuated response to nerve excitation7. The central components involve a failure in the CNS to recruit motor units, which is a reduction in core motor drive.
Since their combination is assumed to occur linearly, the central and peripheral mechanisms have typically been studied separately, which has likely led to biases in the interpretation of the data and the conclusions drawn. These models, which include the cardiovascular/anaerobic model, the energy supply/depletion model, the neuromuscular model, the muscle trauma model, the biomechanical model, the thermoregulation model, and finally the motivational/psychological model, which focuses on the influence of intra psychological factors like performance expectations or the effort required7, have all been thoroughly reviewed by Abbiss and Laursen.
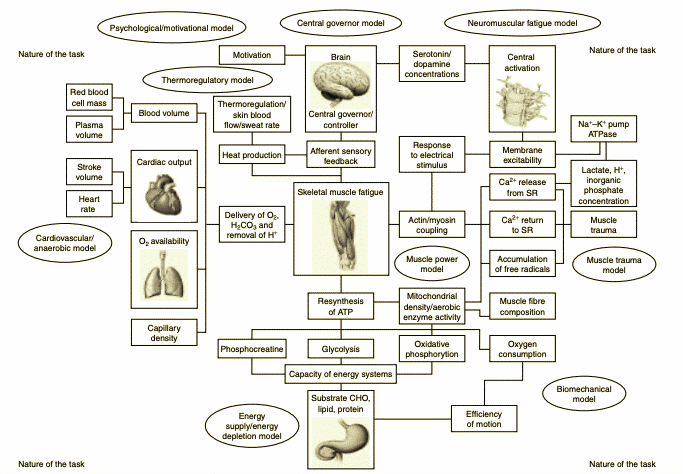
Figure 1 Models to Explain Fatigue 7
Furthermore, according to Noakes, fatigue is a sensory perception rather than a physical phenomenon8. Additionally, there is strong support for a complex, but centrally integrated model of fatigue that includes afferent feedback from the periphery. This model predicts that fatigue will lead to a reduction in work output that may be either consciously or unconsciously determined6.
Furthermore, it has been suggested that each person has a critical level of peripheral muscle fatigue that corresponds to a particular degree of sensory perception of afferent feedback. Notably, independent of the kind of exercise and the individual rate of change of metabolic disruption, the exercise-induced intramuscular level of some metabolites known to generate peripheral tiredness (e.g., protons, phosphate, etc.) is fairly similar in exhaustion9.
In this way, the metabolic environment of the skeletal muscles, which produces energy to support a particular effort, implies a certain affinity to the central nervous system, which will determine the strength of the central motor impulse to continue recruiting a particular number of motor units and subsequently be able to generate or not the required output during exercise9.
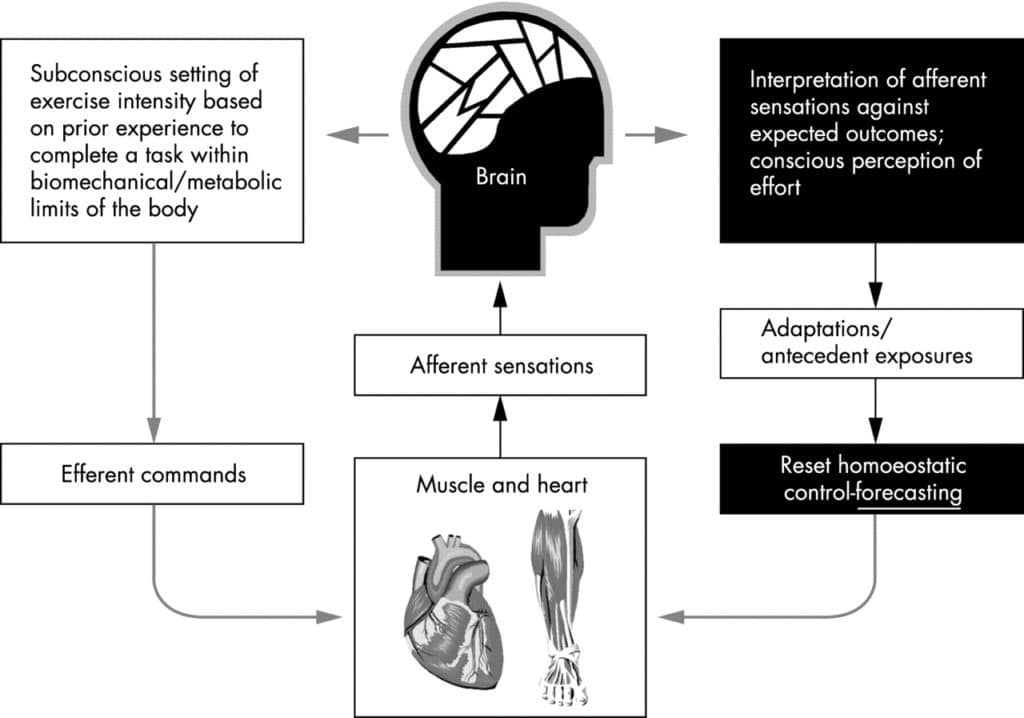
Figure 2 Relation between the teleoanticipatory governor centre in the brain and perceived exertion during exercise 6.
The most accurate definition of fatigue at the moment is "any exercise- or non-exercise-induced loss in performance due to various physiological factors, athlete-reported psychological factors, or a combination of the two."
Neurophysiology, intracellular signalling, vascular function, bioenergetics, and molecular mechanics are just a few of the topics that must be thoroughly understood in order to fully comprehend the nature of skeletal muscle fatigue. Additionally, one must consider the effects of external factors like disease and inactivity on the mechanisms of fatigue3.
Finally, even though the connection between fatigue and some objective measurements is undeniable, it has been proposed that fatigue is also influenced by subjective perception, making it imperative to incorporate a component of "subjectiveness" into the definition of fatigue10. Due to this, possibly the finest currently available definition of fatigue is ‘any exercise or non-exercise-induced loss in performance due to various physiological factors, athlete reported psychological factors or a combination of the two11.
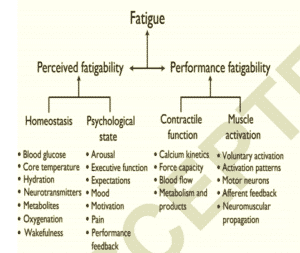
In accordance with the proposed taxonomy, Figure 3, fatigue should be characterised as a self-reported incapacitating symptom resulting from two interrelated attributes: perceived fatigability and performance fatigability.12
It is suggested that fatigue be defined as a symptom in which physical and cognitive function is constrained by interactions between performance fatigability and perceived fatigability in order to provide a more comprehensive rubric12.
Since fatigue by definition lowers an athlete's ability to perform athletically, many coaches have tried to measure their athletes' levels of fatigue on a regular basis in order to modify training regimens as necessary.
Measuring Fatigue
Being able to evaluate tiredness is essential for any coach, trainer, or sports scientist because training at high levels of fatigue can impair or even impede normal adaptation. Athletes' capability to withstand training stress, sensitivity to that stress, or even their performance may depend on how "fresh" they are, therefore understanding this may be helpful.
For the purpose of maximising performance, preventing injuries and overtraining, and putting any periodization model into practise, it is essential to analyse and comprehend the dose-response relationship of an athlete's training programme.
Any physical stress on the body, such as that from training sessions, can be thought of as a "dose," the degrees of weariness that result from that dose as a "response," and the performances that follow as the "outcome." To maximise performance, prevent injuries and overtraining, and adopt any periodization model, it is essential to gather, analyse, and comprehend the dose-response connection of an athlete training programme.
To sum up, the fundamental benefit of developing and putting into practise a fatigue monitoring system is "estimating" how each trainee is responding to a certain programme and then making the necessary adjustments to ensure adaptation, minimise overtraining, prevent injury, and maximise performance.
Subjective Testing
The literature has proven the potential efficacy of subjective measurements for athlete monitoring. The best methods for implementation, meanwhile, have not yet been identified. The quality of the reflection of athlete well-being and the applicability of the data are impacted by implementation practices10.
Additionally, subjective testing can offer immediate feedback and is simple, inexpensive, non-invasive, and equipment-free. On the other hand, ensuring testing sensitivity requires consistency, familiarity, and a strong analysis of the results.
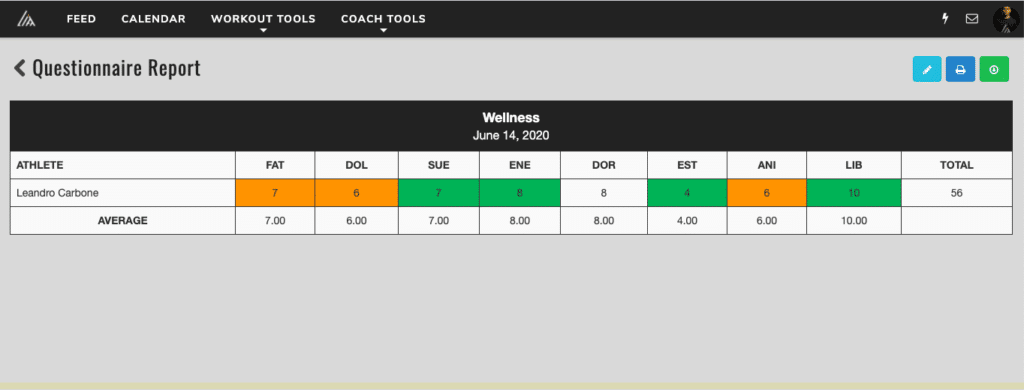
One of the most well-liked methods of gauging subjective well-being is the use of wellness questionnaires, often known as athlete self-report measures. The athlete is simply given a questionnaire to complete in order to rate how they feel. This will frequently cover a variety of subjects, including perceived exhaustion, body discomfort, non-training stress levels, and sleep quality13; but, in actuality, the format and questions utilised will totally depend on the requirements of the coach and the players' backgrounds.
It is crucial to realise that only a small number of surveys have been rigorously verified and proved to be responsive to modifications in weekly training schedules 10,14,15. In any case, wellness surveys seem to be a useful tool for tracking weariness, especially in settings where there are lots of people, like in team sports.
Figure 4: An example of a daily report from a wellness questionnaire. FAT stands for fatigue level, DOL for soreness level, SUE for sleep quality, ENE for energy, DOR for sleep duration, EST for stress, ANI for general well-being, and LIB for libido levels. A number of numerical thresholds have been developed, with the colours green denoting good, yellow normal, and red bad. Information was gleaned from a rugby player.
The athlete is simply given a questionnaire to complete in order to rate how they feel. This will frequently cover a variety of subjects, including perceived fatigue, bodily soreness, non-training stress levels, and sleep quality.
Another arbitrary approach for tracking exhaustion is rating fatigue. Its validity and dependability have been demonstrated11. Using an 11-point scale, this scale is created to give a comprehensive assessment of how worn out a person feels. In addition to having a strong association with physiological exhaustion markers, the Rating of exhaustion Scale also appears to be able to distinguish between perceived exertion during recuperation and during exercise11.
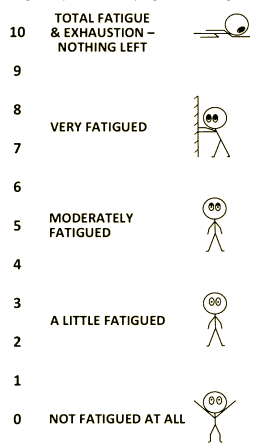
Figure 5 Micklewright et al.'s suggested Rating of Fatigue Scale, 201711.
The science in actual practical application is still far behind new technologies like facial coding, which looks to be accurate at detecting fatigue and mood changes.
Objective Measures
It might be challenging to determine fatigue levels using objective criteria. First and foremost, the procedure used to collect the data must be consistent regardless of the variable we choose to use. It's crucial to properly track and analyse it as well.
It's rather simple to have access to some kinetic, kinematic, or physiological sensors these days thanks to advancements in sports technology, and choosing an objective tracking variable will be limited by this.
The most often used variables tend to be those that affect force production, and methods frequently involve jumping. But there are countless options. The ability to express neuromuscular strength to its fullest extent would undoubtedly qualify as a viable objective metric to evaluate exhaustion. With the correct trustworthy and valid technology and protocol, jumps, isometrics, submaximal squats, throws, etc. can be legitimate choices to evaluate exhaustion.
I'm fortunate to have a dual force plate that can measure vertical force generation as well as all the derivatives of time-dependent variables like RFD, Time to Peak Force, Impulse, etc. I used to use CMJ as well because the majority of the research relies on jumping protocols to determine weariness. However, CMJ and every other jump rely too much on "technique". Please realise that I am not arguing that it is useless; in fact, I continue to collect data from several jumps. However, I've recently changed my readiness assessment from the CMJ to the isometric mid-thigh pull, and the rationale is partly heuristic and partially science-based. I discovered that IMTP is more accessible to athletes and may even be more effective (but I can't prove it).sensitive to change.
Therefore, the IMTP demands that a person pull extremely hard for three to five seconds on a fixed barbell. The test can measure peak force, relative force, RFD, time to peak force, etc. when carried out on top of a force plate16.

Figure 6 Dual Force Plate assessment of an IMTP. Data were taken from a rugby player.
I found that IMTP is easier to explain, implement, and perform by the athletes and maybe (can´t prove it) more sensitive to change.
Additionally, physiological testing such as heart rate, heart rate variability, and other measures of physical condition are frequently used in sports. These metrics include blood or saliva markers as well. Testing for readiness to the autonomic nervous system (ANS) or centrally to the higher centres of the body (CNS) can reveal physiological monitoring of weariness. Although non-invasive sleep monitoring has gained popularity, a clinical evaluation is still necessary to assess the severity of any reported sleep impairment.
Velocity Loss
Force plates are far less common, less portable, more expensive, and possibly less versatile than commercially available devices like linear position transducers (LPT). Even though we typically use them for training purposes, their potential for testing is limitless.
In fact, by definition, monitoring fatigue is one of the most common uses of LPT. Every time we monitor the velocity loss of a specific set, we are making an effort to control fatigue17.
Objective measures of fatigue are typically connected to mechanical variables (mostly force), but not always. However, because force and velocity are linearly related, as the force is applied, the velocity manifests growth as well. Additionally, force and velocity output decrease as fatigue sets in17.
By definition, one of LPT's most common applications is for tracking weariness.
In fact, studies have demonstrated a strong correlation between mechanical (velocity and countermovement jump height losses) and metabolic (lactate, ammonia) measures of fatigue, demonstrating the validity of using velocity loss to measure neuromuscular fatigue during resistance training objectively and transforming velocity loss into a potent tool for driving adaptation17.
Another helpful mechanical variable to measure neuromuscular fatigue is the fastest velocity attained with a constant submaximal weight17,18.
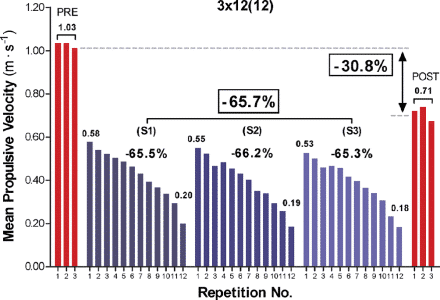 Figure 7 As velocity of given set declines, fatigue arises17.
Readiness
Finally, we´ve already addressed everything about fatigue measure variables, which of them exists, how to choose them and why. But, how to analyze it to properly know what is really going on???
The principle is that if the athlete scores in his or her tests are similar to those of his baseline then he is assumed to be ready to train according to the planned program. Training when not ready is problematic as we´ve already mentioned. But again, how we can know for sure ??
Monitoring fatigue requires an array of data types to properly identify the root cause of the fatigue and whether a change or adjustment is necessary. The essential requirements of monitoring and analyzing fatigue are the collection of quality information and the continuity of the data. Ones we determined which variable we are tracking then we need to establish what type of analysis we are going to perform.
For example wellness questionnaire, as shown before, could be analyzed just with an arbitrary threshold (1-3 bad, 4-7 normal, 8-10 good) then relate those “zones” with colors and we are ready to go.
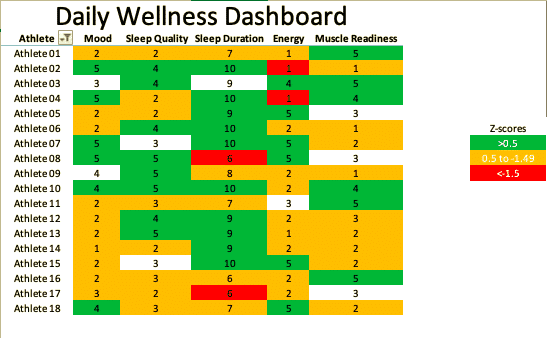
But things could get a little complicated if we want a deeper insight with more robust analysis. If we have a data frame long enough to build a baseline, it could be more sensitive analysis using it for comparison and setting our thresholds as variations (or Z score) across that baseline (see magnitude-based inference blog post for deeper understanding).
Figure 8 Wellnes report dashboard using Z-Scores for establishing readiness Zones.Data were taken from a rugby team.
Finally, sports scientist are investigating how to build models from this data with the use of neural networks and AI. It is still in the early stages but it looks really promising and if they succeed maybe we could have a tool powerful enough to even “predict” future events regarding performance, fatigue or injuries. Time will tell.



No comments:
Post a Comment